 Background |
Models |
Projects |
Publications |
People |
News
Background |
Models |
Projects |
Publications |
People |
News
Background |
Models |
Projects |
Publications |
People |
News
Scope of Projects
Everglades subregional: WCA2A Flow Restoration
Everglades regional: Sulfer & MeHg
Everglades subregional: WCA2A Wading Bird Suitability
Florida Coastal Everglades LTER
Everglades regional: SERES project
Spain Segura Basin: Ecological Economics
Everglades regional: CERP ASR
Everglades regional: CERP Decomp
Everglades WCA-1: unique restoration
Louisiana Davis Pond: restoration prototype
Everglades regional: cal/val (ELM v. 2.8)
Everglades regional: cal/val (ELM v. 2.5)
Each link-suite of comparisons of the Future Base vs. Future Alternative scenario(s) has a single pdf file containing multiple graphical difference-mapsets (1 mapset per Alternative's Variable & its temporal attribute).
Each variable's difference-mapset shows the color-scaled raster results, and vector contours of the area of marsh that exceeds selected ecologically-meaningful thresholds for the variable,
and vector contours of the marsh area of the ecologically-meaningful (+/-) differences between the Base and Alternative for the variable. Simple tables in each map graphic show those area calculations.
Summary comparisons of these marsh areas across multiple Alternative scenarios are provided in tablular and bar graph formats.
Not using standard figure captions, the below difference map figures have the following labeling-characteristics:
See the previous Scenarios simulated table for label/definitions of the Scenarios,
and the previous Performance Measures table for label/definitions of the Performance Measures (and Variables).
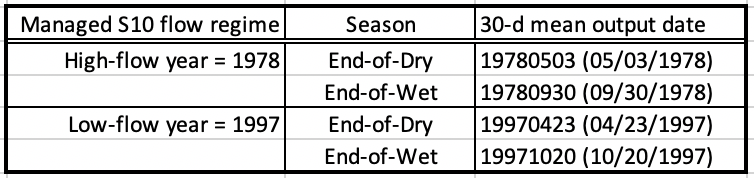
With derivation methods explained in the Task 4 Model Application report (2026) text, the below (Report Table 3) defines the dates of the 30-d mean output files, for the High vs. Low flow years, wet vs. dry seasons.
Map header-label syntax is in either 2 or 3 dot (".") separarated parts, depending on whether it is a Period Of Simulation (POS) statistic:
NEberm subregion difference map results (selected variables, selected temporal)
*** These subregion map results are simply a spatial-zoom of the (later section's) Basin-wide region results.
The primary purpose of creating this NEberm subregion zoom of spatial map Performance Measures is to
quantify the marsh area difference map results that include only this Northeast subregion,
where the most significant hydro-ecological responses to Alternative scenarios are expected (and indeed occurred).
The marsh area of this NEberm subregion is ~30% that of the Basin-wide region.
__________________
POS: All Alternative Scenarios, Variable= Surface Water Depth POSmean  (5 mapsets) 3.7 Mb, 6/29/2026
POS: All Alternative Scenarios, Variable= Surface Water Velocity POSmean (5 mapsets) 3.7 Mb, 6/29/2026
POS: All Alternative Scenarios, Variable= Surface Water Chloride tracer POSmean (5 mapsets) 3.7 Mb, 6/29/2026
NE berm subregion summary table with (MS Excel) comparative bar graphs of contoured marsh areas shown in the above 3 mapsets - for all selected variables, all scenarios. .xlsx 0.1 Mb, 6/29/2026
__________________
HiFlo: All Alternative Scenarios, Variable= Surface Water Depth 30-d mean, High flow year, end of dry season (5 mapsets) 3.7 Mb, 6/29/2026
HiFlo: All Alternative Scenarios, Variable= Surface Water Velocity 30-d mean, High flow year, end of dry season (5 mapsets) 3.7 Mb, 6/29/2026
HiFlo: All Alternative Scenarios, Variable= Surface Water Chloride tracer 30-d mean, High flow year, end of dry season (5 mapsets) 3.7 Mb, 6/29/2026
NE berm subregion summary table with (MS Excel) comparative bar graphs of contoured marsh areas shown in the above 3 mapsets - for all selected variables, all scenarios. .xlsx 0.1 Mb, 6/29/2026
__________________
LoFlo: All Alternative Scenarios, Variable= Surface Water Depth 30-d mean, Low flow year, end of wet season (5 mapsets) 3.7 Mb, 6/29/2026
LoFlo: All Alternative Scenarios, Variable= Surface Water Velocity 30-d mean, Low flow year, end of wet season (5 mapsets) 3.7 Mb, 6/29/2026
LoFlo: All Alternative Scenarios, Variable= Surface Water Chloride tracer 30-d mean, Low flow year, end of wet season (5 mapsets) 3.7 Mb, 6/29/2026
NE berm subregion summary table with (MS Excel) comparative bar graphs of contoured marsh areas shown in the above 3 mapsets - for all selected variables, all scenarios. .xlsx 0.1 Mb, 6/29/2026
Basin-wide region difference map results (all variables, all temporal)
All Variables, Alternative Scenario= AMI, Gaps, Plug (29 mapsets) 20 Mb, 6/29/2026
All Variables, Alternative Scenario= AMI, Gaps (29 mapsets) 20 Mb, 6/29/2026
All Variables, Alternative Scenario= Gaps, Plug (29 mapsets) 20 Mb, 6/29/2026
All Variables, Alternative Scenario= Plug (29 mapsets) 20 Mb, 6/29/2026
All Variables, Alternative Scenario= Gaps (29 mapsets) 20 Mb, 6/29/2026
Go back to the main page of Everglades subregional: WCA2A Flow Restoration
EcoLandMod Projects