 Background |
Models |
Projects |
Publications |
People |
News
Background |
Models |
Projects |
Publications |
People |
News
Background |
Models |
Projects |
Publications |
People |
News
Scope of Projects
Everglades subregional: WCA2A Flow Restoration
Everglades regional: Sulfer & MeHg
Everglades subregional: WCA2A Wading Bird Suitability
Florida Coastal Everglades LTER
Everglades regional: SERES project
Spain Segura Basin: Ecological Economics
Everglades regional: CERP ASR
Everglades regional: CERP Decomp
Everglades WCA-1: unique restoration
Louisiana Davis Pond: restoration prototype
Everglades regional: cal/val (ELM v. 2.8)
Everglades regional: cal/val (ELM v. 2.5)
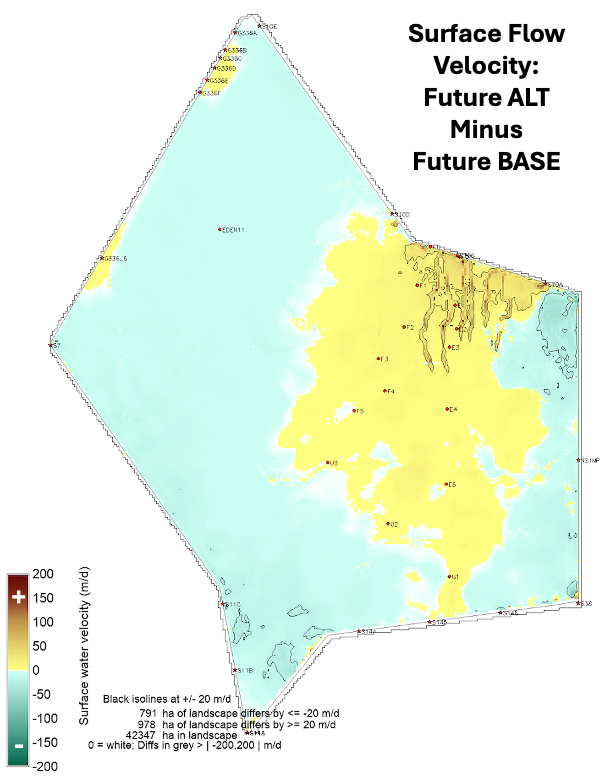
The target audience for this page is that of the scientists and managers interested in restoring/enhancing water flows and depths in the NorthEast and Central area of Everglades Water Conservation Area 2A (WCA-2A).
The Everglades Systems Assessment Section of the South Florida Water Management District (SFWMD) provided the funding to EcoLandMod for this work.
Tending towards technical information, this page provides the SFWMD science team, and managers, with comprehensive results of ELM simulation of hydro-ecological responses to scenarios of altered system management.
Model and data refinement for this project, along with future scenario assumptions, condensed-results summaries, and results synthesis - are found in the 3 report links in the Introduction below.
This Project evaluated and modified the flow characteristics in the northeastern sector of Water Conservation Area 2A (WCA-2A) of the Everglades, thus influencing much of the basin. Of primary interest is the influence of the elevated berm that was originally built along the southern side-boundary of the borrow canal that receives managed inflows from the S10A, -C, and -D structures (the Hillsboro Canal levee is along the northern side-boundary of the borrow canal). If continuous, the berm (hereafter referred to as the NEberm) tends to block or reduce canal-overbank flows to the south into the receiving marsh, and thus "short-circuiting" flows towards the eastern basin boundary.
Extensive efforts were made in our Project's Task 2 Ground Elevation and Vegetation Data report (2025) to integrate-synthesize new elevation survey data, and to characterize model-scale elevation of the narrow berm (and of the entire basin). That effort included the synthesis of new marsh vegetation data. The EcoLandMod system was used to develop/refine a new fine-scale (100 m grid) hydro-ecological simulation model for the WCA-2A basin. The Task 3 Model Performance report (2026) demonstrated very good/excellent model skill in predicting hydrologic and water quality trends at spatio-temporal scales necessary for analysis of this project.
With this subregional (437 km2, 169 mi2) Everglades Landscape Model (ELM3wca2_100) application, the model was then used to evaluate the relative hydro-ecological benefits of alternative scenarios of changes to the NEberm and vicinity. Managed hydrology of these future scenarios were all driven by the SFWMD "Current Schedule" marsh stage regulation schedule, using ELM water management algorithms. All daily managed inflows to the basin were assigned recent historical mean values (temporally constant, differing among water control structures) of chloride and phosphorus concentrations in that flow into the system.
We applied the model to evaluate the extent to which future scenarios - of berm gap alterations, downstream Active Marsh Improvement (AMI) vegetation removal, and/or canal infrastructure modifications - can improve hydroperiods/depths and restore/enhance north-to-south flow in the NEberm area, while assessing potential downstream phosphorus impacts. The Task 4 Model Application Report (2026) described the model data & assumptions for future scenarios, and quantified hydro-ecological responses to those future alternative scenarios in the NEberm area, including responses cascading downstream.
####
#### Future scenarios' model data & assumptions, condensed-results summaries, and results synthesis - are found in the above Task 4 Model Application Report.
Here we provide the full set of quantitative Performance Measures used to evaluate the future Alternative scenarios; most of these detailed Peformance Measures were not included in that Report due to space limitations. Moreover, this web page contains links to archives of all raw model output files.
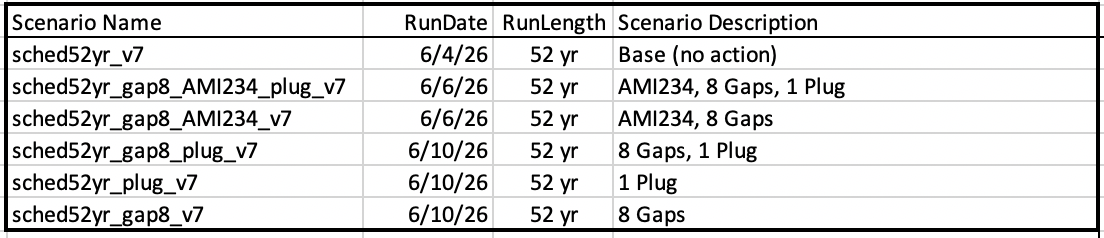
The future Alternative scenarios (including the future Base scenario) used in this Project. The RunDate is the date that the simulation was executed. All simulations encompassed the 52 year, January 1965 - December 2016 climate record. AMI234 refers to the 3 pairs (2, 3, 4 out of 6) of historical sloughs used to define the Project's AMI locations. The 8 Gaps refer to NEberm elevation gaps, and the 1 Plug refers to the canal plug in the NEberm borrow canal. See the "Input Data" section, and "Assumptions - Base, Alternatives, Scenarios" sections, in Task 4 Model Application report (2026) for spatial definitions and derivations of these data modifications for the scenarios.
____________________________________________________________________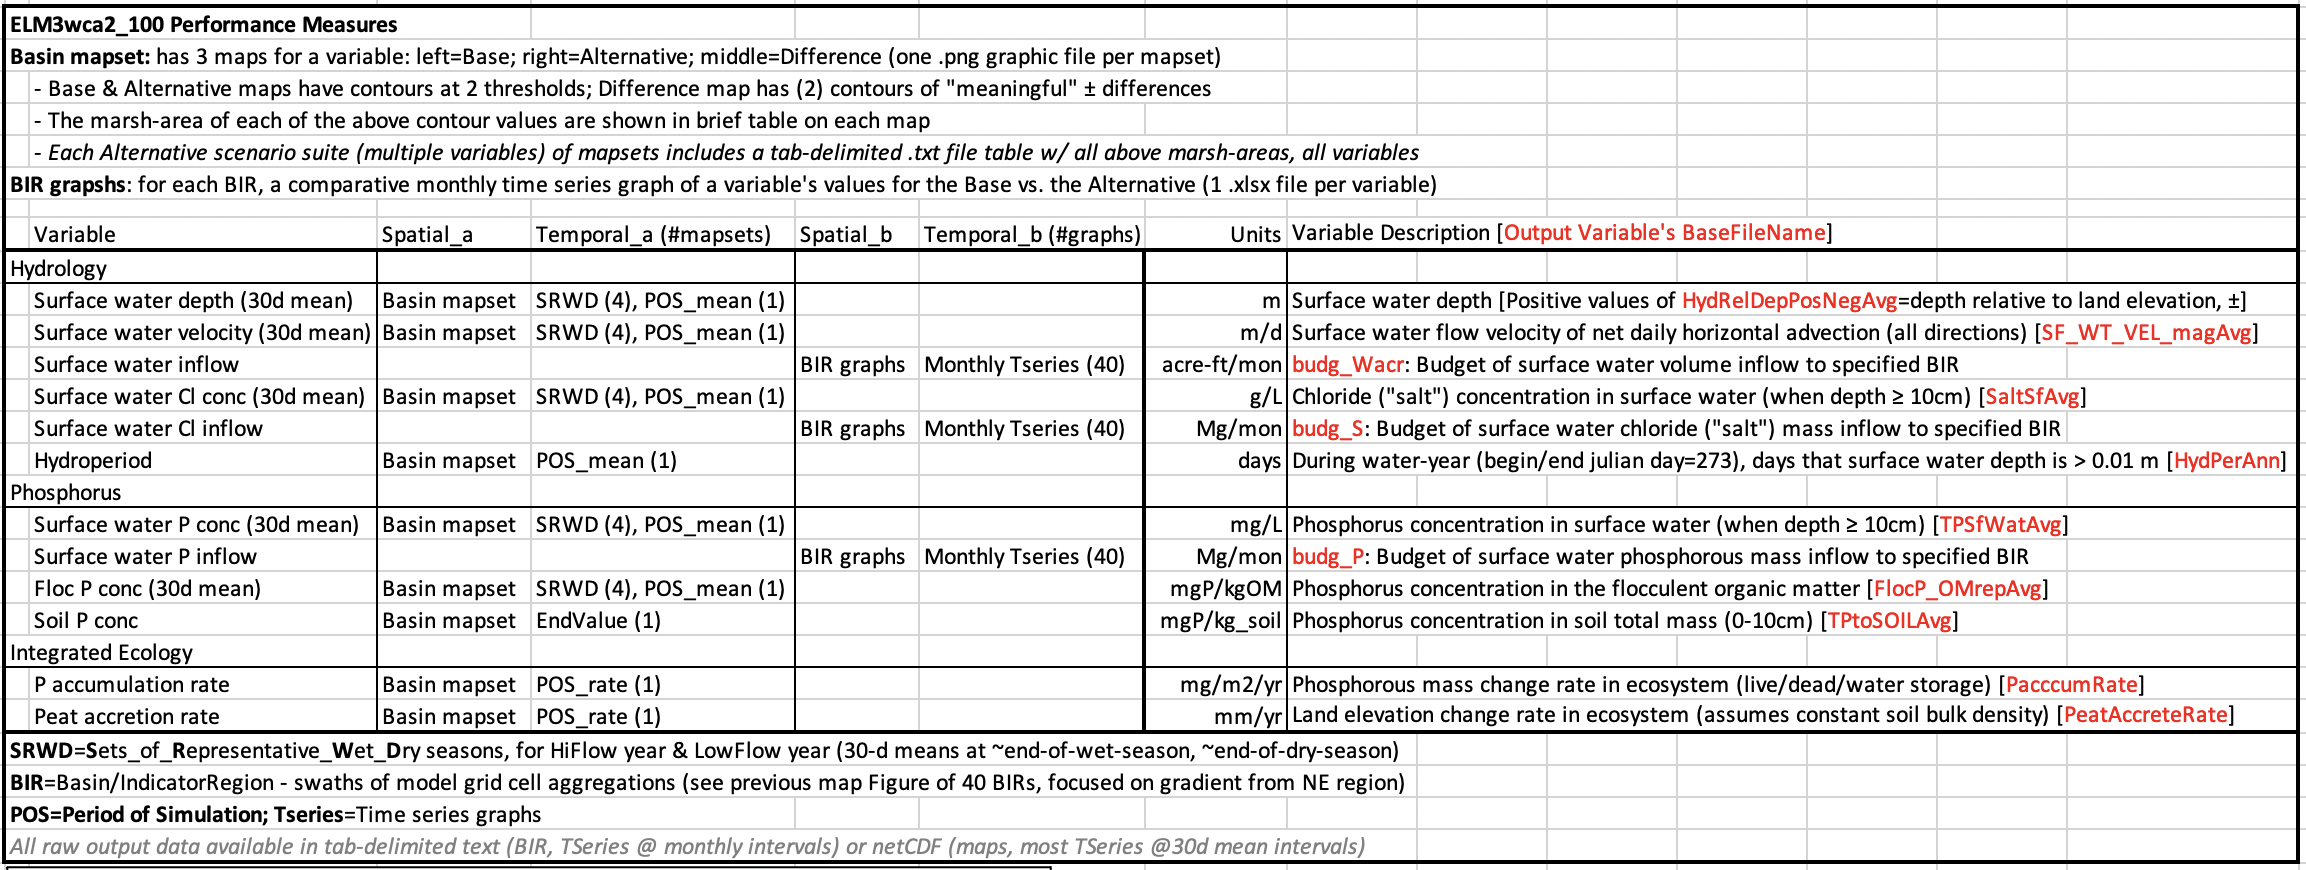
The hydro-ecological Performance Measures used to evaluate the relative differences between future Base and future Alternative scenario(s). For more detail, including definition/delineation of BIRs and SRWD, see the "Performance Measures" section in the Task 4 Model Application report (2026).
____________________________________________________________________For making relative comparisons of the future Base to future Alternatives, we used the Performance Measures (above table) at varying spatial and temporal scales.
Performance Measures: Maps
 All Base vs. Alternative scenarios, difference-maps comparisons
Performance Measures: Graphs
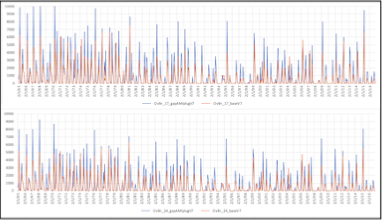 All Base vs. Alternative scenarios, difference-graphs comparisons
A set of links to .zip archives of all of the Project's ELM3wca2_100 future scenario output files.
____________________________________________________________________
EcoLandMod Projects