 Background |
Models |
Projects |
Publications |
People |
News
Background |
Models |
Projects |
Publications |
People |
News
Background |
Models |
Projects |
Publications |
People |
News
Scope of Projects
Everglades subregional: WCA2A Flow Restoration
Everglades regional: Sulfer & MeHg
Everglades subregional: WCA2A Wading Bird Suitability
Florida Coastal Everglades LTER
Everglades regional: SERES project
Spain Segura Basin: Ecological Economics
Everglades regional: CERP ASR
Everglades regional: CERP Decomp
Everglades WCA-1: unique restoration
Louisiana Davis Pond: restoration prototype
Everglades regional: cal/val (ELM v. 2.8)
Everglades regional: cal/val (ELM v. 2.5)
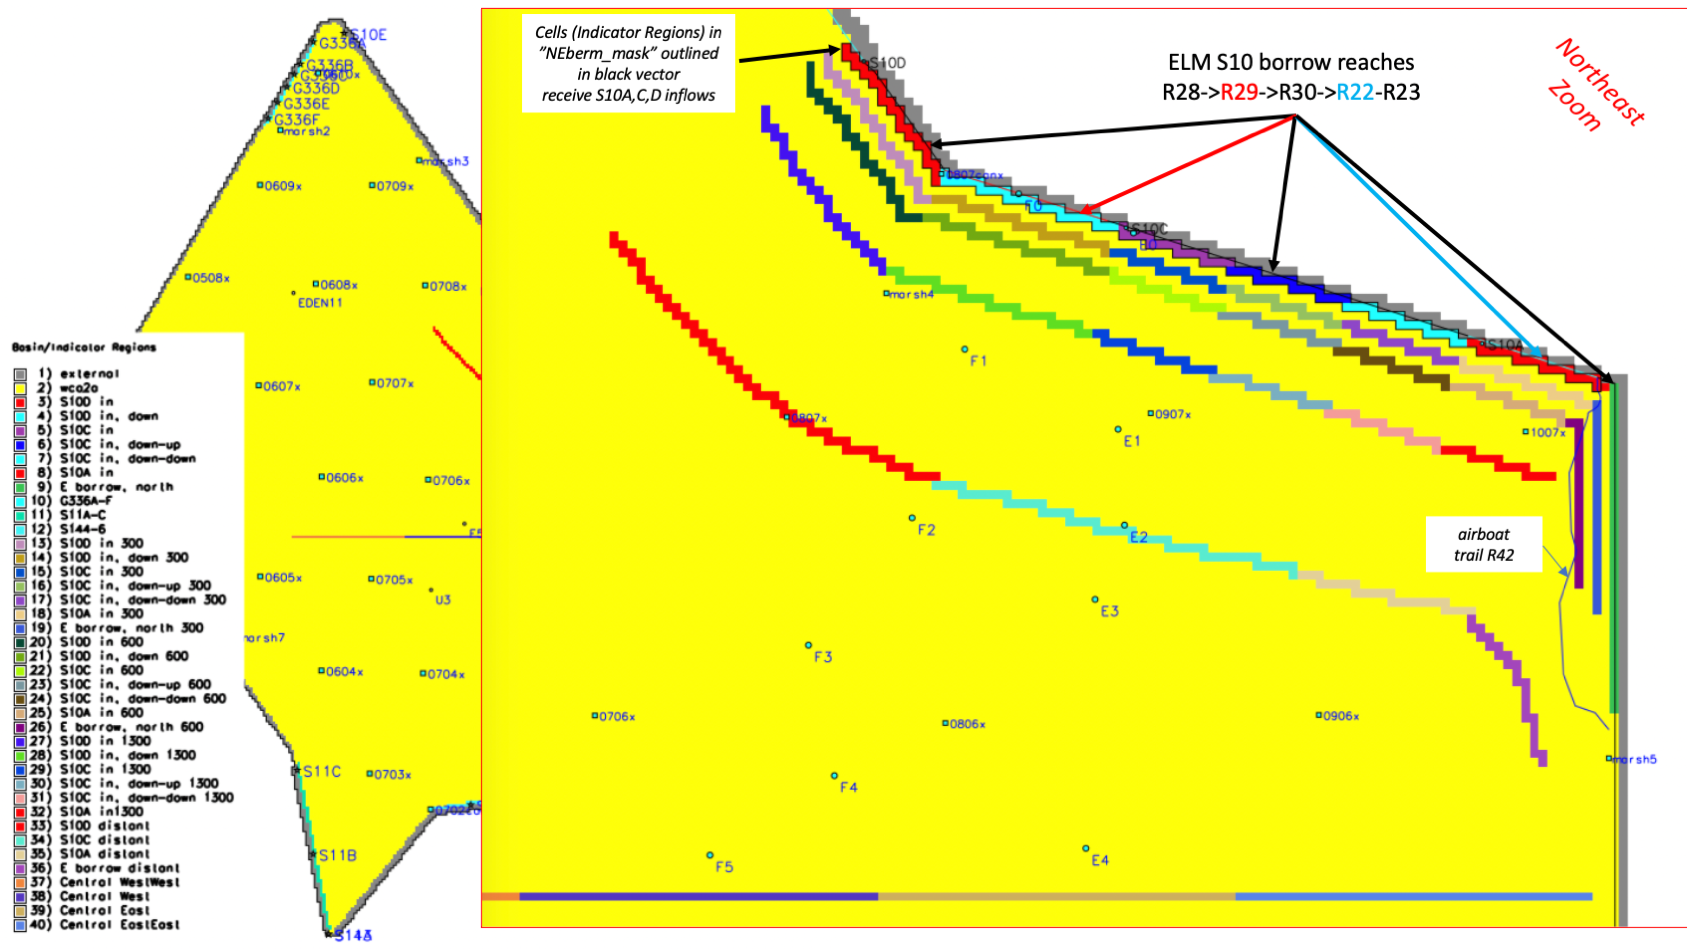
ELM Basins/Indicator Regions (BIRs), and a "zoom" into the Indicator Regions in the Northeast region that is our Project focus.
--- ELM-budget FYI regarding Basins vs Indicator Regions: ELM "Basins" are strictly hydrologic basins; there are two in the ELM3wca2_100 model: cells that are inside the levees of WCA-2A ("wca2a", BIR=2), and model cells that are external to the levees ("external", BIR=1).
--- ELM "Indicator Regions" are independent sub-sets of a single ELM Basin. The Basin (wca2a) budget, however, is the sum of all Indicator Regions (3 through 40), plus that of the area shown in yellow of the graphic. In other words,
the BIR=2 is the true budget of the entire hydrologic basin inside the levees of WCA-2A (and not merely that of the area shown in yellow of the graphic).
Each comparison of the Future Base vs. a Future Alternative scenario has 2 MS Excel files, each containing graphs (&data) of inflow budgets for all BIRs: 1) file-link for water inflows, and 2) file-link for chloride inflows.
Each MS Excel file is self-documenting, starting with the left-most "StartHere" tab in the Excel file. The "BIR_map" tab shows the map of BIR locations. The "GraphsLayout" tab shows a bird's-eye view arrangement of the 36 Base vs. Alternative graphs (4 BIRs not relevant, as shown). The "Graphs" tab contains all of the graphs, arranged spatially (as shown in the "GraphsLayout" tab).
____________________________________________________________________
Difference graph results
BIR inflow budget comparisons for- Water: Alternative Scenario: AMI, Gaps, Plug .xlsx (36 graphs) 11 Mb, 6/29/2026
BIR inflow budget comparisons for- Chloride: Alternative Scenario: AMI, Gaps, Plug .xlsx (36 graphs) 11 Mb, 6/29/2026
BIR inflow budget comparisons for- Water: Alternative Scenario: AMI, Gaps .xlsx (36 graphs) 11 Mb, 6/29/2026
BIR inflow budget comparisons for- Chloride: Alternative Scenario: AMI, Gaps, .xlsx (36 graphs) 11 Mb, 6/29/2026
BIR inflow budget comparisons for- Water: Alternative Scenario: Gaps, Plug .xlsx (36 graphs) 11 Mb, 6/29/2026
BIR inflow budget comparisons for- Chloride: Alternative Scenario: Gaps, Plug .xlsx (36 graphs) 11 Mb, 6/29/2026
BIR inflow budget comparisons for- Water: Alternative Scenario: Plug .xlsx (36 graphs) 11 Mb, 6/29/2026
BIR inflow budget comparisons for- Chloride: Alternative Scenario: Plug .xlsx (36 graphs) 11 Mb, 6/29/2026
BIR inflow budget comparisons for- Water: Alternative Scenario: Gaps .xlsx (36 graphs) 11 Mb, 6/29/2026
BIR inflow budget comparisons for- Chloride: Alternative Scenario: Gaps .xlsx (36 graphs) 11 Mb, 6/29/2026
Go back to the main page of Everglades subregional: WCA2A Flow Restoration
EcoLandMod Projects