![]() Background |
Models |
Projects |
Publications |
People |
News
Background |
Models |
Projects |
Publications |
People |
News
![]() Background |
Models |
Projects |
Publications |
People |
News
Background |
Models |
Projects |
Publications |
People |
News
Scope of Projects
Everglades regional: Sulfer & MeHg
Everglades subregional: WCA2A Wading Bird Suitability
Florida Coastal Everglades LTER
Everglades regional: SERES project
Spain Segura Basin: Ecological Economics
Everglades regional: CERP ASR
Everglades regional: CERP Decomp
Everglades WCA-1: unique restoration
Louisiana Davis Pond: restoration prototype
Everglades regional: cal/val (ELM v. 2.8)
Everglades regional: cal/val (ELM v. 2.5)
 We are collaborating on multi-decadal research and modeling in the coastal Everglades
as part of the FCE LTER program. The regional 500 m resolution application of Everglades Landscape Model (ELM) serves as a framework
in a multi-modelling approach to understanding ecological (esp. nutrient and salinity) gradients in the southern Everglades, with a current focus
on the evolution of socio-ecological dynamics in south Florida that may occur with long term climate change. See our FCE Modeling and Scenarios group's summary for more
information on our modeling-research progress and plans.
The target audience for this page is the scientific community interested in Everglades hydro-ecological dynamical responses to future scenarios.
The Model Documentation report on the major update to ELM v3.2 historical (calibration/validation) performance assessment,
which we are using in support of additional model experiments and future scenario evaluations, is found in the Publications link.
The older Model Documentation report on the ELM v2.8.4 historical (calibration/validation) performance assessment
(including data, code, model performance assessment, and user's guide) is found in the Publications link. (Note: Code changes from ELM v2.8.4 to v2.8.6 and v2.9.0 do not effect any results related to this project).
Note: Those performance documentation reports are separate from the documentation of the ELM applications that support the FCE Climate & Sea Level Rise project, which is the topic of this web page.
Here we document the assumptions and results of applying ELM v2.9.0 for this FCE Climate Change and Sea Level Rise project.
Over the past several years, a collaboration organized by Florida Atlantic University and several government agencies involved multi-stakeholder workshops to develop plausible scenarios of future climate change and sea level rise (SLR) in south Florida.
As part of this effort, the South Florida Water Management Model (SFWMM) was run under a variety of such future scenarios (Obeysekera et al. 2014).
Daily flows through water control structures from those SFWMM runs drove the managed flows of the ELM, which explicitly integrates dynamic flux equations of hydrology, nutrients, plants, and soils (Fitz et al. 2011,
Fitz and Paudel 2012). As detailed in Obeysekera et al. (2014), the 36-year Baseline future run
assumed 2010 initial conditions, to which two future scenarios were compared: (a) a 10% decrease in precipitation, an increase of 1.5 degrees C and associated 7% increase in potential ET, and a 50-cm rise in sea level and
(b) a 10% increase in precipitation, an increase of 1.5 degrees C and associated 7% increase in potential ET, and a 50-cm rise in sea level.
In the encroaching marine-influenced subregion: water depths and salinities increased under both scenarios along a topographic-influenced gradient; phosphorus accumulation rates generally increased under both scenarios,
due to higher phosphorus concentrations in marine sources; and peat accretion rates generally decreased under both scenarios due to interactions between changing habitat types, altered nutrient availability,
increased salinity, and subsequent decreases in plant productivity. Freshwater habitat (e.g., sawgrass marsh) area decreased by more than 25% under both scenarios and was largely replaced by mangroves and,
in the increased rainfall scenario, open water as well. Adaptive planning efforts that foster upward peat accretion may help support both mangrove and freshwater marsh habitats. We infer that ecological effects related
to sea level rise may occur in extremely oligohaline water, that topography will control the incursion of this zone as sea level rises, and that differences in freshwater availability will have ecologically significant effects within the oligohaline zone.
We published these manuscripts (Flower et al. 2017, 2019) on the project and results.
See also this April 2017 (26 Mb) PowerPoint presentation of some of the principal results from the project.
This section links to documentation of model assumptions, inputs, and outputs for the Climate_Base, decRFincET, and incRFincET simulation runs.
Timeline of updates to this page.
Page Contents - Major headings

Whereas we previously posted results of the above 2014 and 2016 simulations, for simplicity we now only include the latest (2017) simulations, which most acurately/effectively represent the interactions among hydrology, soils, and vegetation under these future scenarios.
____________________________________________________________________
Note: The changes to rainfall and potential ET were made by modifying two parameters that applied globally across space and time. Initial sea level increase was made by alterations to tidal boundary condition time series data. Please see the below "Summary table of input data for simulations".
 0.4 Mb - Summary table of input data for simulations (from CERP Decomp PIR1 project; same as current project).
 1.2 Mb - Input map data that are common to all project simulations (from CERP Decomp PIR1 project; same as current project).

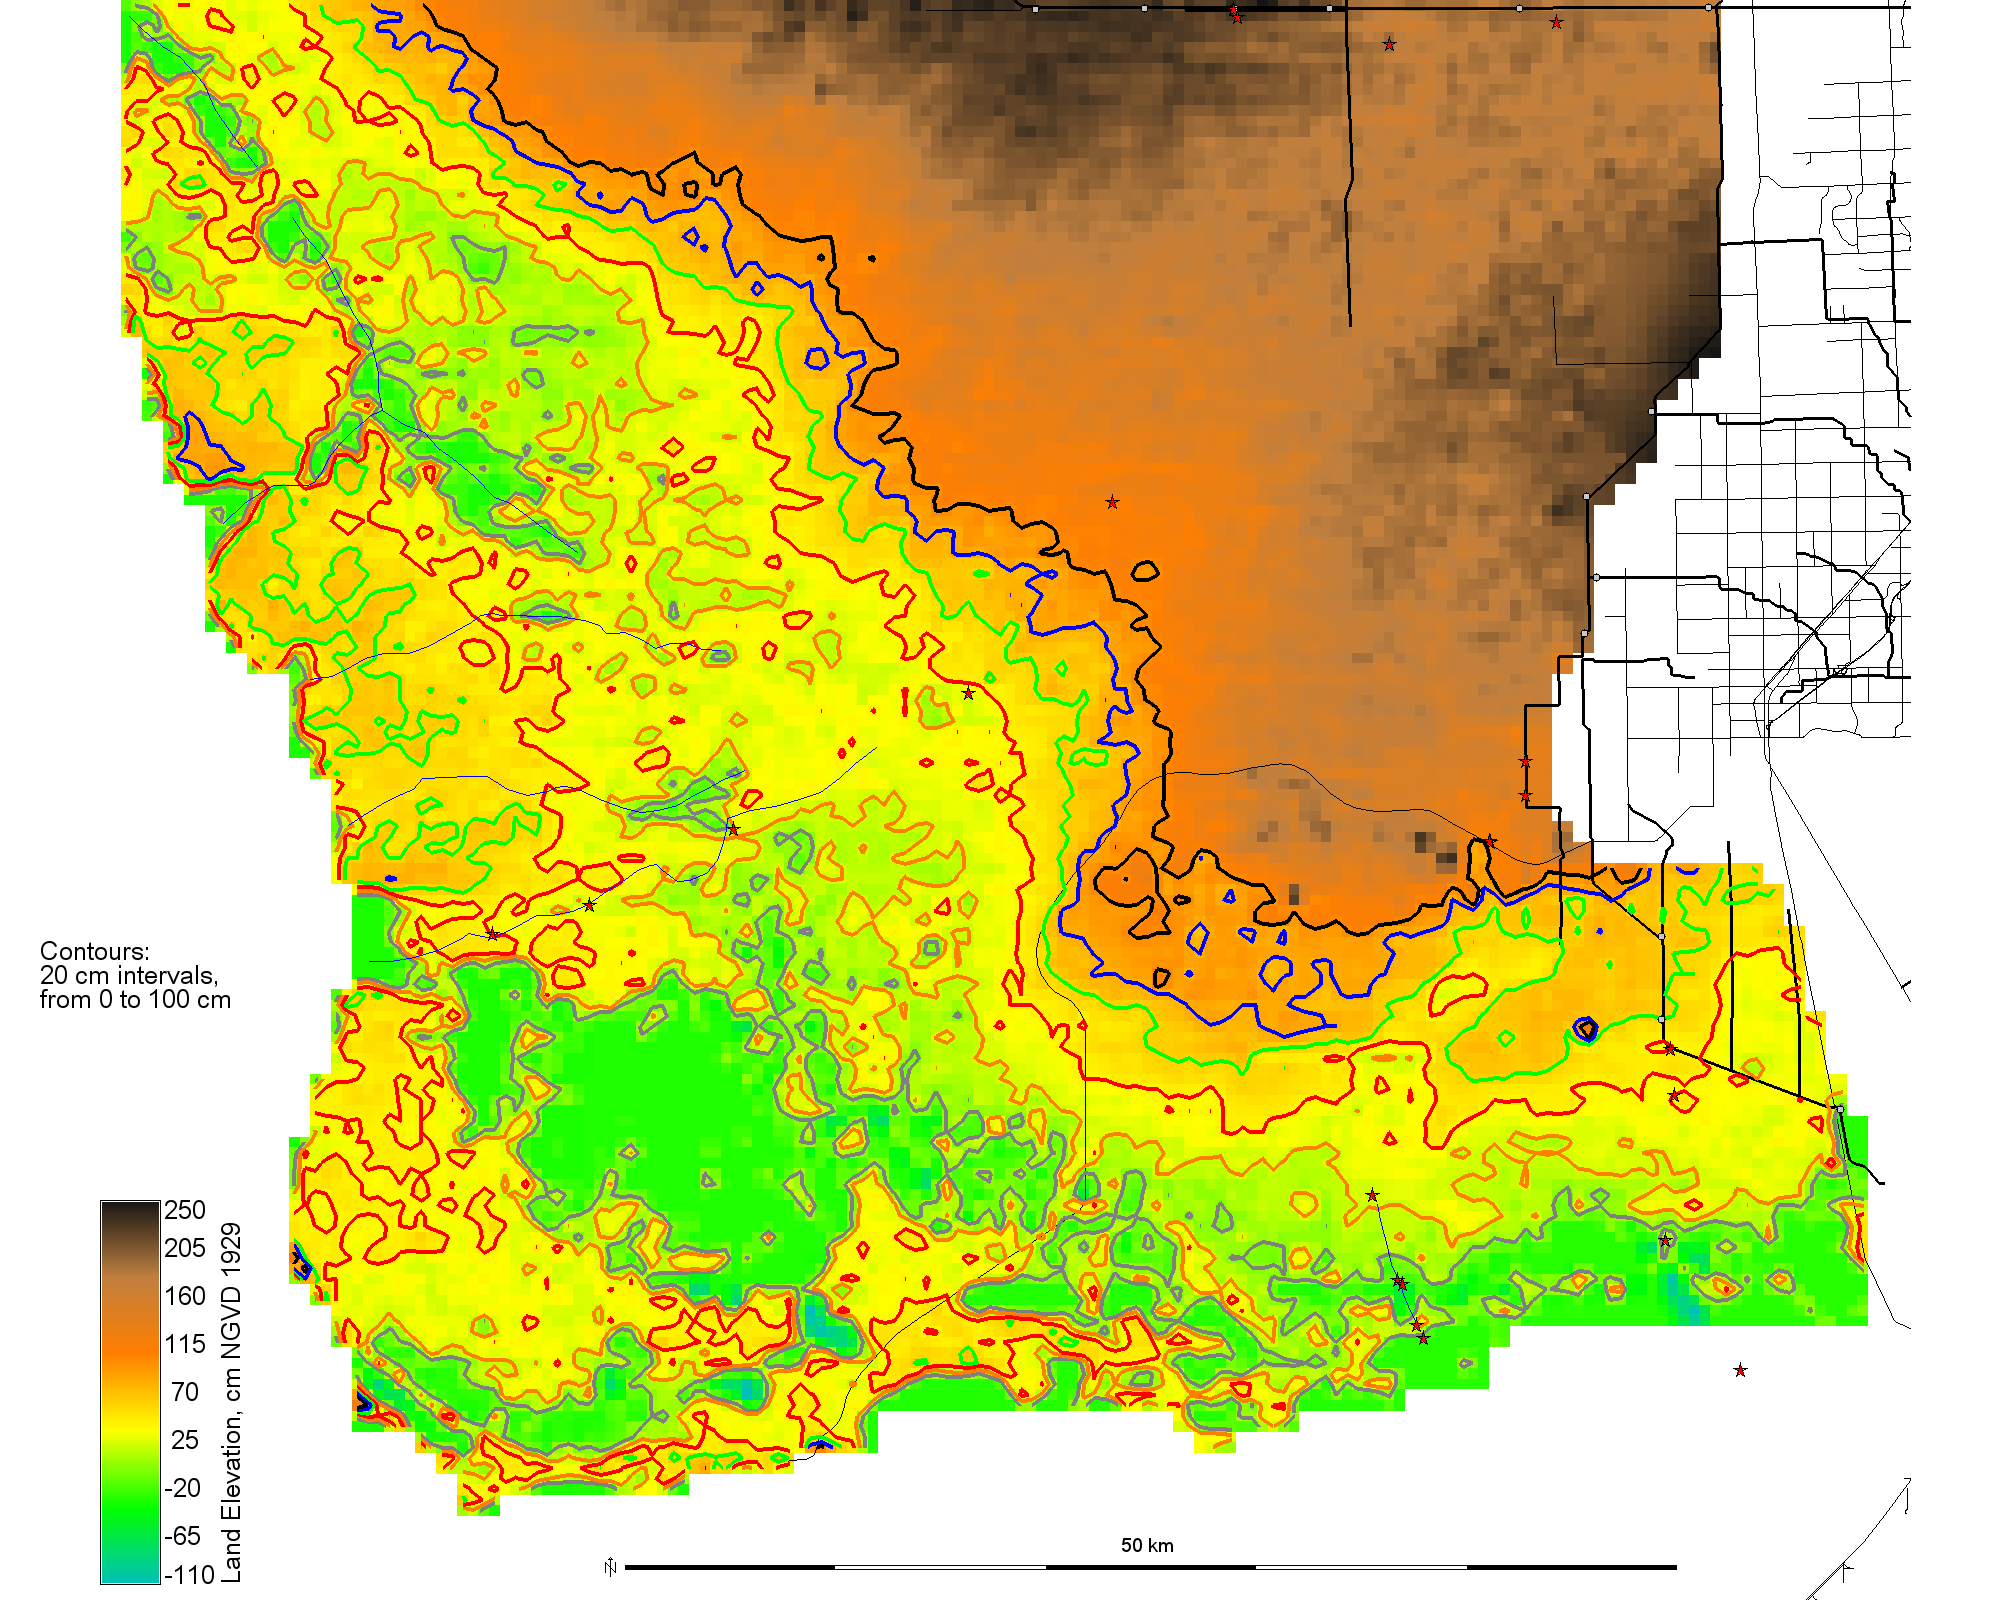
Initial land elevation common to all simulations, zoomed into ENP-FCE domain. This topo drives most of the results seen below.
For detailed hydrologic assumptions used by the SFWMM (whose managed water control structure flows drive these ELM simulations), please see Obeysekera et al. 2014).
Water management infrastructure data (no changes among the 3 simulations)
0.1 Mb, July 27, 2011 - Canal/levee and water control structure map. (Existing Condition Base (ECB) from the CERP Decomp PIR1 project; same as current project).
 9.3 Mb, July 27, 2011 -
Water control structure attributes, including into-domain constituent (P, Cl) inflow concentrations (database export graphic). (Existing Condition Base (ECB) from the SERES project; same as current project).
(Below is the same file summary used in the CERP Decomp PIR1 project, and does not include what Decomp team referred to as ELM supplementary metrics). Performance Measures are quantitative metrics used to make relative comparisons among baseline and alternative simulations.
 0.1 Mb, Sep 1, 2011 -
Summary table of the Performance Measures that are used to make relative comparisons among ELM-simulated baselines and alternatives.
Includes description of the Performance Measures, and guidance on their use and interpretation.
(These Performance Measures were developed by the Decomp PDT members in spring 2011, based on RECOVER Performance Measures and related documents).
For evaluations of the FCE Climate & SLR project, we made relative comparisons of the 2010 Base to the two climate and SLR scenarios. Note that is important to understand
that none of these future projections should be considered accurate predictions of a highly uncertain future, but RELATIVE comparisons among simulations provide a useful understanding
of the possible range of hydro-ecological responses to plausible future climate and sea level changes.
The 2010 Base assumes current water management infrastructure and operations (i.e., no Comprehensive Everglades Restoration Plan or other restoration projects), projecting how the system may respond
over a 36-yr future period if there were no changes to those existing water management practices.
Both future climate scenarios also assumed current water management infrastructure and operations, projecting how the system may respond over a 36-yr future period if there were no changes to
those existing water management practices, but under altered climate and sea level dynamics.
For highly dynamic hydro-ecological variables, Performance Measures include difference maps of:
a) landscape Period of Simulation mean ("MeanPOS" in variable's name), and
b) landscape seasonal "snapshots" which are end-of-season 30d averages ("MeanRAW" in variable's name) for three example years:
In addition to the Performance Measures described above (for CERP Decomp PIR1 project), for this project we provide a larger suite of hydro-ecological metrics. Included are difference-maps for
decRFincET scenario
Performance Measure Maps

 38.7 Mb, Feb 25, 2017 - decRFincET vs Climate_Base: Maps of the hydro-ecological differences between the two simulations.
incRFincET scenario
Performance Measure Maps

 37.3 Mb, Feb 25, 2017 - incRFincET vs Climate_Base: Maps of the hydro-ecological differences between the two simulations.
Raw output files (Climate_Base, decRFincET, incRFincET (outdated, example-only))
 ForEverView_ELM2.8reg500BAS2010.zip
202.5 Mb, Nov 22, 2014 - A zip archive of the "Raw" model output of the Water Depth Relative to Land Surface (RelDepPosNeg) for the three simulations we used, in netCDF format; each netCDF file is a map-time-series of 30-day mean variable values during the 36-yr Period of Simulation.
 EcoLandMod Projects